⏱ Proper innovation KPIs

I've been heavily involved in defining an innovation KPI strategy for two very large industries in Europe these last months. You might assume it's quite a drag; it's anything but. Defining KPIs for innovation is the final touch of defining strategic priorities, framing a proper innovation portfolio, aligning disjoint historic innovation initiatives, and working on the cultural perspective on success.
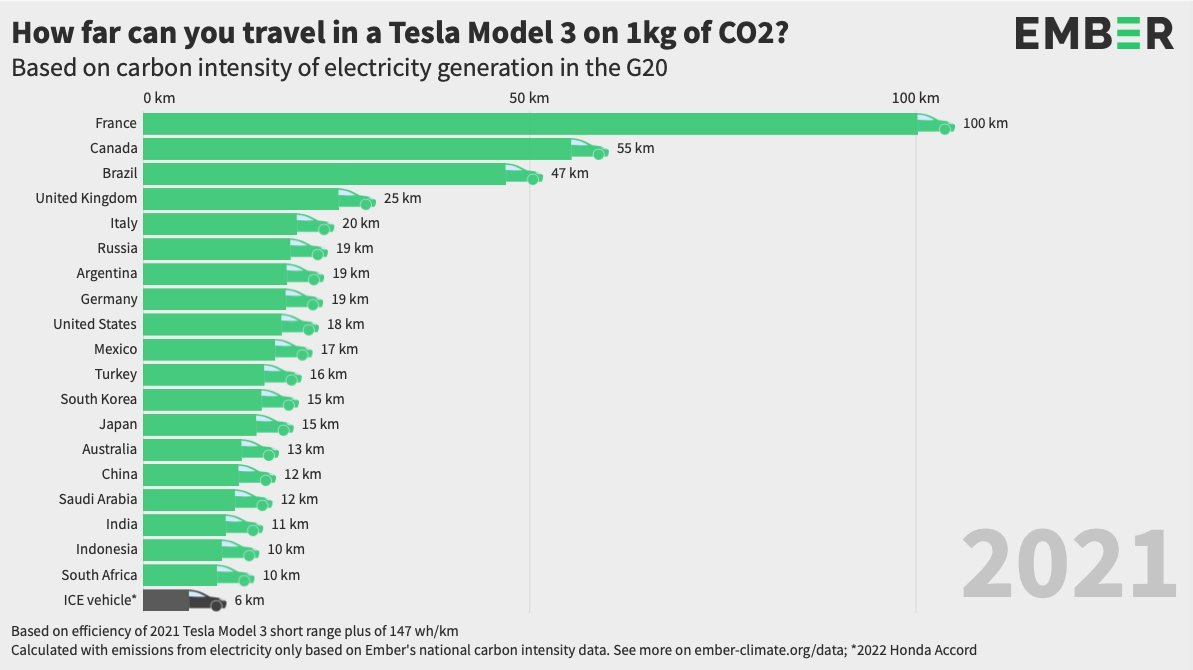
So when I saw this graph a few days ago, I knew it was worth mentioning as a fantastic example of what are proper innovation KPIs ⤵️
To be clear, I don't know if the information is 100% correct, but if you assume it is, why is it such a good innovation KPI?
Five reasons:
- It's looking forward to a clear problem to be solved (for cars to become 'clean' when needed to achieve energy grid CO2 neutrality).
- It takes only a single striking example to illustrate a vastly complex reality (it's very smart because the Tesla Model 3 is at the same time ahead of the EV curve but also quite representative of this niche).
- It gives a practical measurement that anyone can relate to (a kilogram, not tons) and visually understand (not gigawatts).
- It gives a simple baseline (the thermic 'ICE' vehicle) and already shows that not all progress is that worthwhile.
- It can be put in dynamic mode very easily (how many km will we gain or lose if we opt for this or that modification in a given national energy mix?).
Building innovation KPIs is about walking many fine lines. What would be your get-go measurement in your industry?